
Bitcoin is back at a level traders know well. On Tuesday, BTC hovered just above $83,100. That is the lower edge of last week’s range. Nothing broke. Nothing crashed. Yet the mood changed. Bond yields are climbing. Oil is near $107. The Federal Reserve may not be done raising rates. Meanwhile, crypto sentiment still sits close to greed. That gap is the real story. In this analysis, we break down what pushed Bitcoin lower, why Zcash fell 12%, which levels matter next, and how traders can prepare for Wednesday’s key inflation report. Read on for a clear, data-led view of the setup.
Bitcoin Price Today: What Actually Happened
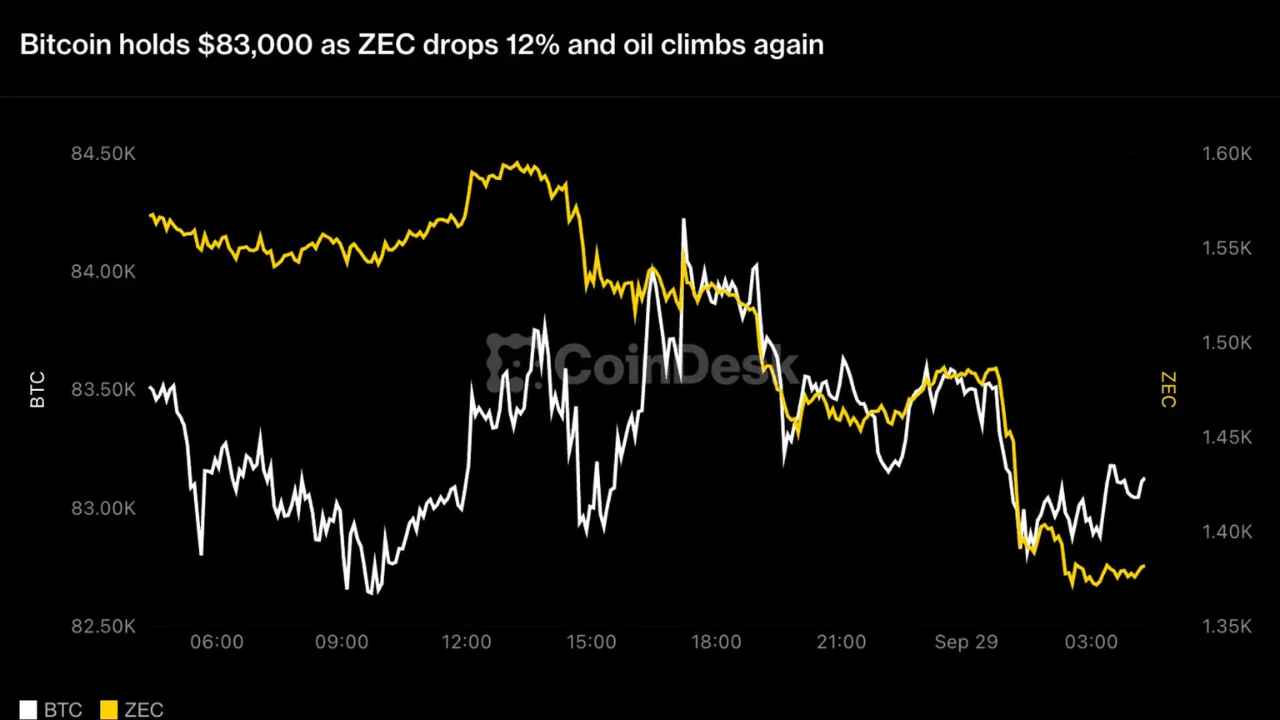
Let’s start with the tape. Bitcoin slipped by less than 1% during Asian trading hours on September 29. It landed just above $83,100. Recently it had traded above $87,000. So the pullback is real, but it is not a collapse. Total crypto market value stayed near $2.86 trillion. Ether stayed flat. That tells us sellers are picky, not panicked. Think of it like a tired runner slowing at a hill. The legs still work, but the pace has dropped. Traders now watch whether Bitcoin can hold this floor or slide through it. The next few sessions matter.
- BTC price: about $83,100, down under 1%
- 10-year Treasury yield: 5.25%, highest since 2007
- Brent crude: nearly $107 a barrel
- Total crypto market cap: near $2.86 trillion
- Sentiment index: 74 out of 100
Why Rising Treasury Yields Hurt Bitcoin
The biggest pressure point is the bond market. The 10-year Treasury yield touched 5.25%, its highest level since 2007. It nudged up one basis point in Asia after Monday’s spike. Why does that matter for Bitcoin? Simple. A government bond pays you interest with very little risk. Bitcoin pays nothing. When safe yields rise, the bar for holding non-yielding assets goes up. Money often rotates toward bonds. Buyers of BTC need a stronger reason to stay. That is the quiet mechanism behind this pullback. It does not need a headline hack or a ban. Just math.
Higher yields also change how big funds think. A pension desk or hedge fund compares every asset against the risk-free rate. At 5.25%, that hurdle is steep. Bitcoin must promise returns well above it to justify its volatility. This is called opportunity cost. It rarely makes noise. It works slowly, like water on stone. Yet it can cap rallies for weeks. Also, Monday’s Wall Street selloff was tech-led, and Nasdaq 100 futures slipped another 0.3%. Bitcoin often trades like a risk asset in these moments. So watch yields closely. If they cool, Bitcoin usually breathes easier. If they climb, expect more tests of support.
Oil Near $107 Adds Fuel to Inflation Fears
Now add oil. Brent crude rose more than 1% to nearly $107 a barrel. That is its second straight daily gain. The trigger was fading hope of a quick diplomatic breakthrough with Iran. Oil matters because it touches everything. Fuel costs feed into shipping, food, and factory prices. Higher costs then feed into inflation. Inflation keeps central banks on edge. So a barrel of oil in the Middle East can shift a Bitcoin chart in Asia. It sounds distant. It is not. Energy is the first domino in this chain, and Bitcoin sits at the far end.
Fed Rate Hike Bets and the PCE Test
Traders are adding to bets that the Federal Reserve will raise rates again. That is a tough backdrop for speculative assets. Higher rates make borrowing costlier. They also drain liquidity from risk assets. Crypto has tended to thrive when money is cheap and plentiful. It struggles when money gets expensive. The Fed is not targeting Bitcoin, of course. But its decisions set the mood for every speculative market. Right now, that mood is cautious. Every inflation print becomes a mini-referendum on the next rate move, and crypto feels each one. So the next data point carries extra weight.
Wednesday brings the moment of truth. The Commerce Department will publish August’s personal consumption expenditures price index. This is the inflation gauge the Fed watches most closely. A hotter-than-expected number would strengthen rate-hike bets. It would also push Treasury yields even higher. That is the exact pressure behind Bitcoin’s slide from above $87,000. A softer reading would do the opposite. It could relax yields and give risk assets some room. So the PCE report is not just another data release. It is the trigger that could decide whether $83,000 holds or cracks. Traders should expect sharp moves around publication.
Zcash Falls 12%: Why Smaller Tokens Hurt More
Zcash was the weakest major token on the board. ZEC dropped 12% to about $1,380. That is a large move for a major coin. Privacy coins can swing harder than the broader market. Liquidity is often thinner. Sentiment can flip fast. When Bitcoin wobbles, smaller and more speculative tokens tend to fall further. This is the classic high-beta effect. Still, one bad day does not make a trend. CoinDesk’s report cites no specific trigger for the drop. So check volume, exchange flows, and project news before drawing conclusions. Absent a catalyst, profit-taking and risk reduction are plausible explanations.
The Altcoin Scoreboard
Not every token bled. The Graph’s GRT jumped 18%, and Immutable’s IMX rose nearly 10%, according to FxPro. That shows money still hunts for stories. Traders rotate into fresh momentum, even on red days. But the majors told a calmer tale. SOL and HYPE lost 3% to 4%. DOGE dipped 3%, BNB 2%, and XRP nearly 2%. Ether and TRX stayed flat. That pattern points to selective selling, not a broad exit. Investors are trimming risk, not abandoning the market. Here is the day’s scoreboard for the tokens that moved most:
- Biggest losers: ZEC (-12%), UNI (about -10%), BCH (about -10%), DASH (-7%)
- Biggest gainers: GRT (+18%), IMX (nearly +10%)
- Flat: ETH and TRX
Crypto Greed vs Stock Market Fear
Here is the odd part. A widely watched crypto sentiment index read 74 out of 100 on Monday. That is just below the extreme greed zone. Yet stock markets have felt fear for about 20 days, according to FxPro. Two markets, two moods. Such gaps tend to close. Either crypto sentiment cools, or stocks recover. Extreme greed often marks short-term tops, because most eager buyers have already bought. That does not guarantee a drop. But it does suggest limited fuel for upside. Cooling sentiment could even be healthy. It clears excess leverage and gives the next rally firmer ground.
A Hidden Positive: Bitcoin’s Relative Strength
There is a hidden positive here. Yields hit their highest since 2007, oil rose again, and global stocks slid to their lowest since September 18. Yet Bitcoin lost under 1%. That is relative strength. Markets under real stress usually show deeper damage. Instead, BTC is simply testing the floor of its range. Ether stayed flat, too. Bulls can argue that buyers are absorbing the pressure. Bears can argue the damage is only delayed. Both views are fair. What we know is that price has not broken yet. Until it does, the range remains the main framework for decisions.
Key Bitcoin Support and Resistance Levels
Now the chart. Alex Kuptsikevich, chief market analyst at FxPro, sees $83,000 as the lower edge of last week’s consolidation. He expects a retest near $82,000, where peaks formed in May and early September. Old highs often act as support. Below it, $80,000 becomes the line in the sand. A sustained return below that level would signal the market is not ready to climb soon. On the upside, fresh momentum could carry Bitcoin well above $90,000. Here are the levels worth marking on your chart:
- $90,000: upside target if bullish momentum returns
- $87,000: high before this pullback
- $83,000: current test of the range floor
- $82,000: likely retest zone
- $80,000: key breakdown level
How Traders Can Navigate This Setup
So how should traders approach this? Start with patience. Wednesday’s PCE data can whipsaw prices in minutes. Chasing the first candle is a classic mistake. Wait for the reaction to settle. Next, size positions carefully. Volatility around macro events can trigger stops on both sides. Use defined risk. Know where your idea is wrong before you enter. Finally, watch the drivers, not just the chart. Yields, oil, and rate expectations are moving Bitcoin right now. If those three cool, the chart usually improves. If they heat up, support levels get tested. Keep this checklist handy:
- 10-year Treasury yield near 5.25%
- Brent crude near $107
- Iran diplomacy headlines
- PCE inflation data
- Fed rate-hike expectations
Macro-driven markets punish common habits. Here are three mistakes to avoid. First, ignoring the calendar. Trading blind into PCE day is a gamble, not a strategy. Second, over-leveraging. Heavy leverage can turn a routine 3% swing into a liquidation. Third, assuming every dip is a bargain. Some dips are simply the start of a lower range. Instead, plan for both outcomes. Write your bullish and bearish scenarios before the data drops. Decide your entry, stop, and target in advance. Then follow the plan. Emotion is expensive in fast markets, and discipline is the cheapest edge any trader owns.
Long-term investors face a different question. Should you buy this dip? There is no single answer. A gradual approach can suit uncertain markets better than a lump sum. Dollar-cost averaging spreads risk across time and eases the pressure of picking a bottom. Also keep perspective. Bitcoin sits within a range, not in free fall. Total market value near $2.86 trillion shows the ecosystem remains large and active. Still, never invest money you cannot afford to lose. Leverage is especially risky when macro events can shift prices fast. Do your own research, and consider speaking to a licensed financial advisor about your situation.
Beyond the Price: Institutions Keep Building
Price is only one part of the story. Under the surface, institutions keep building. CoinDesk reported that Goldman Sachs is bringing a $100 billion Treasury fund into crypto’s institutional infrastructure. It also noted that Franklin Templeton is taking its tokenized collateral service to Bybit. These are not price catalysts for this week. They are structural signals. Traditional finance wants blockchain rails for settlement and collateral. That trend can continue even when Bitcoin trades sideways. Short-term traders may ignore it. Long-term investors should not. Infrastructure built in quiet markets often supports the next expansion when macro pressure finally eases.
Bitcoin Price Outlook
Here is the balanced outlook. The bearish case is simple. Yields stay high, oil keeps climbing, and PCE surprises to the upside. In that world, Bitcoin likely revisits $82,000 and may test $80,000. The bullish case needs a calmer macro tape. A softer inflation print, easing oil, or a diplomatic breakthrough could relieve pressure. Then the range holds and buyers return, with $90,000 back in view. My base case sits in between. Expect choppy trading between roughly $82,000 and $87,000 until data clears the air. Bitcoin is waiting for a catalyst, and Wednesday may deliver one.
Final Thoughts
Bitcoin at $83,000 is not a crisis. It is a checkpoint. The market is weighing three forces at once: a 10-year yield at its highest since 2007, oil near $107, and the risk of more Fed rate hikes. Crypto has stayed resilient so far, but elevated sentiment leaves little room for error. Zcash’s 12% drop reminds us how quickly smaller tokens can lose ground. Meanwhile, gainers like GRT show opportunity still exists. Stay flexible. Track the data. Respect the levels. And remember that in crypto, patience often beats prediction. Wednesday’s PCE print will tell us a lot.
Disclaimer: This article is for information only and is not financial advice. Crypto assets are volatile. Always do your own research.