
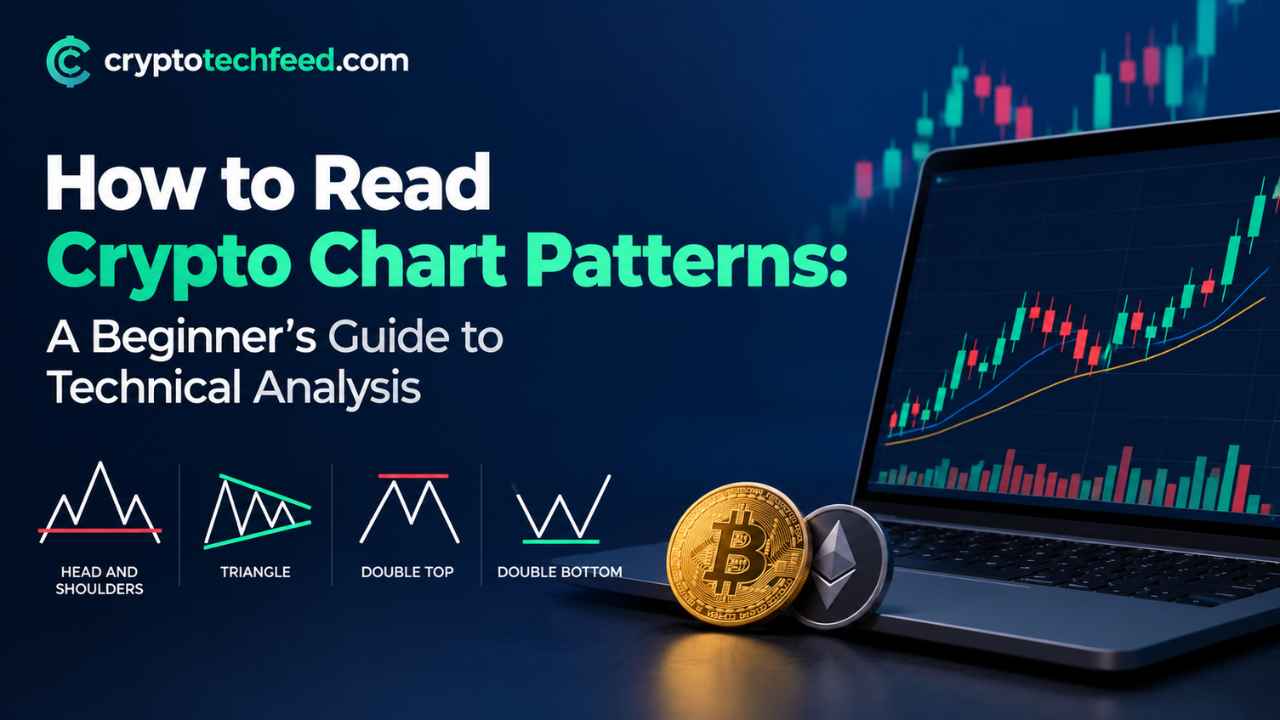
You open your exchange app, and there it is. A wall of green and red candles that looks like someone spilled a box of crayons on a screen. Everyone around you seems to know what it means. You don’t. And honestly, that gap between “I bought crypto” and “I understand what this chart is telling me” is where most beginners get stuck.
Get full Crypto Coverage at Cryptotechfeed.com
Here’s the good news. Reading a crypto chart isn’t some secret language reserved for Wall Street veterans. It’s a skill, the same as reading a map or learning to parallel park. Clumsy at first, then almost automatic. This guide walks you through the actual building blocks, the ones traders lean on every single day, so the next time you look at a chart it stops looking like noise and starts looking like a story.
What Chart Patterns Actually Tell You
A chart pattern is just price history with a shape. Every candle on the screen records a battle between buyers and sellers over a set period, and when you zoom out, those battles start forming recognizable shapes. Triangles, flags, double tops, cups with handles. None of these shapes predict the future with certainty. What they do is show you where buying pressure and selling pressure have historically flipped, which gives you a probability, not a promise.
Think of it like reading footprints in wet sand. You can’t see the person who walked there, but the depth and spacing tell you whether they were running, strolling, or standing still deciding which way to go. That’s what price action is. A record of collective decision making, frozen on a screen.
Support and Resistance Lines: The Real Foundation
Before touching a single indicator, learn support and resistance. This is the one concept that shows up in literally every other tool on this list, so skipping it is like trying to learn a language without learning the alphabet first.
Support is a price level where buying interest has repeatedly stepped in and stopped a fall. Picture it as a floor. Resistance is the opposite, a price ceiling where sellers keep showing up to cap a rally. Draw a horizontal line across two or three points where the price bounced or stalled, and you’ve got yourself a support or resistance line.
What makes these lines genuinely useful is what happens when price breaks through one. A resistance level that finally gets smashed through on high volume often flips into new support. Traders call this a “flip zone,” and it’s one of the most reliable visual cues on a chart. If you remember nothing else from this guide, remember this: price rarely moves in a straight line, it moves between these invisible walls, testing them again and again until one finally gives way.
Top 7 Crypto Trading Indicators Every Beginner Should Know
Indicators take raw price and volume data and turn them into something visual you can act on faster. You don’t need all of them running at once, that’s a rookie mistake called analysis paralysis. Pick two or three that complement each other. Here’s the checklist worth actually learning.
- Moving Averages (MA and EMA) — Smooth out price noise into a single flowing line, showing you the general direction without the jitter of every candle.
- RSI (Relative Strength Index) — Measures momentum on a scale of zero to a hundred, flagging when an asset might be overbought or oversold.
- MACD (Moving Average Convergence Divergence) — Tracks the relationship between two moving averages to catch shifts in momentum before price fully confirms them.
- Bollinger Bands — Three lines that expand and contract around price, showing you when volatility is compressing before a potential breakout.
- Volume — The most underrated indicator on this list. A price move without rising volume behind it is a move you should not trust.
- Fibonacci Retracement — Maps out likely pullback zones after a strong move, based on ratios that show up again and again in market psychology.
- Ichimoku Cloud — A denser, all in one system that shows trend, momentum, and support and resistance in a single glance once you learn to read the cloud.
Start with moving averages and RSI. Once those feel intuitive, layer in MACD and volume. The rest can wait.
RSI and MACD Explained, Without the Jargon
These two get asked about more than any other pair of indicators, so they deserve their own breakdown.
RSI sits on a scale from zero to a hundred. Traditionally, a reading above 70 signals an asset might be overbought, meaning it’s climbed fast and could be due for a pullback. A reading below 30 signals oversold, meaning it’s dropped hard and might be due for a bounce. But here’s the part beginners miss: in a strong trending market, RSI can sit above 70 for days and keep climbing anyway. Don’t treat these numbers as automatic buy or sell signals. Treat them as a warning light on your dashboard, something that tells you to pay closer attention, not slam the brakes.
MACD works differently. It’s built from two exponential moving averages, and when the faster line crosses above the slower one, that’s typically read as bullish momentum building. When it crosses below, that’s read as bearish momentum. There’s also a histogram underneath the main lines, and when those bars start shrinking even while price keeps rising, that’s often an early sign momentum is fading before the price itself turns. Traders call this divergence, and catching it early is genuinely one of the more useful skills in this whole toolkit.
Use RSI and MACD together rather than alone. RSI tells you how stretched a move is. MACD tells you whether momentum actually agrees. When both point the same direction, that’s a stronger signal than either one on its own.
Bullish Chart Patterns Crypto Traders Watch For
Now for the fun part, the shapes themselves. Picture each of these forming on your screen as you read.
Cup and Handle: Price falls gradually, curves back up forming a rounded U shape like a coffee cup, then dips slightly one more time forming a small handle before breaking out upward. It’s a slow, patient pattern that often signals accumulation.
Double Bottom: Two dips at roughly the same price level, separated by a bounce in between, forming a W shape. It suggests sellers tried twice to push price lower and failed both times, often followed by a move higher.
Ascending Triangle: A flat resistance line up top with a rising trendline underneath, squeezing price into a narrowing wedge. Buyers keep showing up at higher lows while sellers defend the same ceiling, and when that ceiling finally breaks, it often breaks with force.
Bull Flag: A sharp upward move followed by a short, calm, slightly downward drifting consolidation that looks like a flag on a pole. It usually resolves with another leg up in the same direction as the original move.
Inverse Head and Shoulders: Three troughs, where the middle one dips lower than the two on either side. It looks exactly like an upside down version of the bearish head and shoulders pattern, and it’s one of the more statistically respected reversal signals in technical analysis.
None of these patterns work in isolation. A cup and handle forming near a strong support zone, confirmed by rising volume and a bullish MACD crossover, tells a far more convincing story than any single piece on its own.
Picking the Right Timeframe
One thing nobody tells beginners upfront: the exact same coin can look bullish on one timeframe and bearish on another, at the exact same moment. Zoom into a 15 minute chart and you might see a sharp drop. Zoom out to the weekly chart and that same drop is barely a blip inside a much bigger uptrend. Neither view is wrong. They’re just answering different questions.
If you’re holding for weeks or months, the daily and weekly charts matter far more than anything happening hour to hour. If you’re trading short term swings, the four hour and one hour charts become your main workspace, though it still helps to glance at the daily chart first just to know which direction the bigger current is flowing. A pattern that forms on a higher timeframe generally carries more weight than the same pattern on a lower one, simply because more traders and more capital were involved in shaping it.
Common Mistakes Beginners Make
A few things trip up nearly everyone starting out. Trading every signal an indicator throws instead of waiting for two or three to agree. Ignoring volume entirely, which is like watching a movie with the sound off. Drawing support and resistance lines to fit a bias you already have, instead of letting the price action speak first. And treating chart patterns as guarantees rather than probabilities, which is honestly the biggest one. Technical analysis improves your odds. It doesn’t hand you certainty, and anyone selling you certainty is selling you something else entirely.
Final Thoughts
Reading crypto charts is less about memorizing every pattern in existence and more about training your eye to notice where buyers and sellers keep showing up. Start with support and resistance. Layer in two indicators you actually understand. Learn to recognize a handful of patterns by their shape alone. Everything else builds from there, slowly, the same way any real skill does.
Frequently Asked Questions
What is the easiest chart pattern for beginners to learn? Support and resistance lines are the easiest starting point since nearly every other pattern and indicator builds on that same concept of price bouncing between floors and ceilings.
Is RSI or MACD better for crypto trading? Neither is strictly better. RSI measures how stretched a move is, while MACD measures whether momentum agrees with that move. Most traders use them together rather than choosing one over the other.
How long does it take to learn to read crypto charts? Most beginners feel reasonably comfortable spotting support, resistance, and basic patterns within a few weeks of regular practice, though refining judgment on when signals actually confirm can take months.
Do chart patterns actually work in crypto markets? They work as probability tools rather than guarantees. Crypto markets are more volatile than traditional markets, so patterns can fail or invalidate faster, which makes confirmation from volume and indicators especially important.