
Picture this. You find a token trading at a 50 million dollar market cap. Feels tiny, feels like it has room to run. You buy in. Three months later you check CoinGecko out of curiosity and notice a second number sitting quietly under the market cap you never clocked before. Fully diluted valuation: 900 million dollars. Your “cheap” 50 million dollar coin was never actually cheap. You were looking at maybe 6 percent of the real picture.
Get full crypto coverage at Cryptotechfeed.com
That gap between what a token looks like and what it actually is, is tokenomics. Not the whitepaper diagrams nobody reads, the actual mechanics of how many tokens exist, who holds them, when the locked ones unlock, and how fast new supply gets printed. Get this wrong and it doesn’t matter how good the product is. The math eats you anyway.
What Is Crypto Tokenomics, Really
Tokenomics is short for token economics, and at its core it’s just supply and demand with extra steps. It covers total supply, circulating supply, who the tokens were allocated to, how new tokens enter circulation over time, and what mechanisms, if any, remove tokens from circulation.
Here’s the part most beginners skip past. A token’s price isn’t really set by how good the technology is. It’s set by how many tokens are competing for buyer demand at any given moment, and tokenomics is the blueprint for exactly how that competition changes over the next one, two, five years. A brilliant protocol with a badly designed emission schedule can bleed out slowly for years. A mediocre protocol with tight, well timed supply can outperform for a while on structure alone. Neither outcome has much to do with the underlying tech.
Breaking Down a Token Distribution: The Infographic in Your Head
Every serious token has a pie chart somewhere showing how the total supply gets split. Picture the wedges. Team and founders usually sit around 15 to 20 percent. Early investors and VCs often take another 15 to 25 percent. Community incentives, ecosystem grants and liquidity mining might claim 20 to 40 percent. A foundation or treasury wedge covers ongoing development, and a public sale or airdrop allocation, often the smallest slice, is what retail actually gets to buy at launch.
That pie chart alone tells you almost nothing though. The real story is in a second image: a timeline running left to right, showing exactly when each wedge unlocks. This is where most buyers stop looking, and it’s the single biggest mistake in the whole process.
Crypto Vesting Schedule Analysis: Reading the Timeline Properly
A vesting schedule is the release plan for tokens that aren’t immediately liquid. Picture a horizontal bar. At the very start sits the cliff, a flat, dead period where zero tokens unlock no matter how much time passes. After the cliff ends, the bar usually slopes upward, either in monthly or quarterly chunks, or as one continuous linear drip.
Token vesting cliff, defined plainly, is the delay before any locked allocation becomes claimable. A standard VC and team allocation in 2026 still tends to follow something close to a one year cliff on top of a three or four year total vesting period. That means for twelve months after launch, insiders can’t sell a single locked token. Then, often right at the twelve month mark, a large single tranche unlocks all at once, followed by smaller monthly or quarterly releases for the following two or three years.
Doing crypto vesting schedule analysis properly means plotting that unlock timeline against the token’s actual trading volume. If a project’s average daily volume is 2 million dollars and a cliff unlock is about to release 40 million dollars worth of insider tokens in a single week, you don’t need a finance degree to guess which direction that pushes price. The market has to absorb that new supply, and if demand isn’t growing just as fast, it gets absorbed through a falling price instead.
Token Inflation Rate and the Emissions Curve
Circulating supply doesn’t just sit there once it’s unlocked. Most networks keep minting new tokens on a schedule, usually to pay validators, stakers or liquidity providers for securing the network. That ongoing mint rate is the token inflation rate, and the shape it takes over time is the token emissions curve.
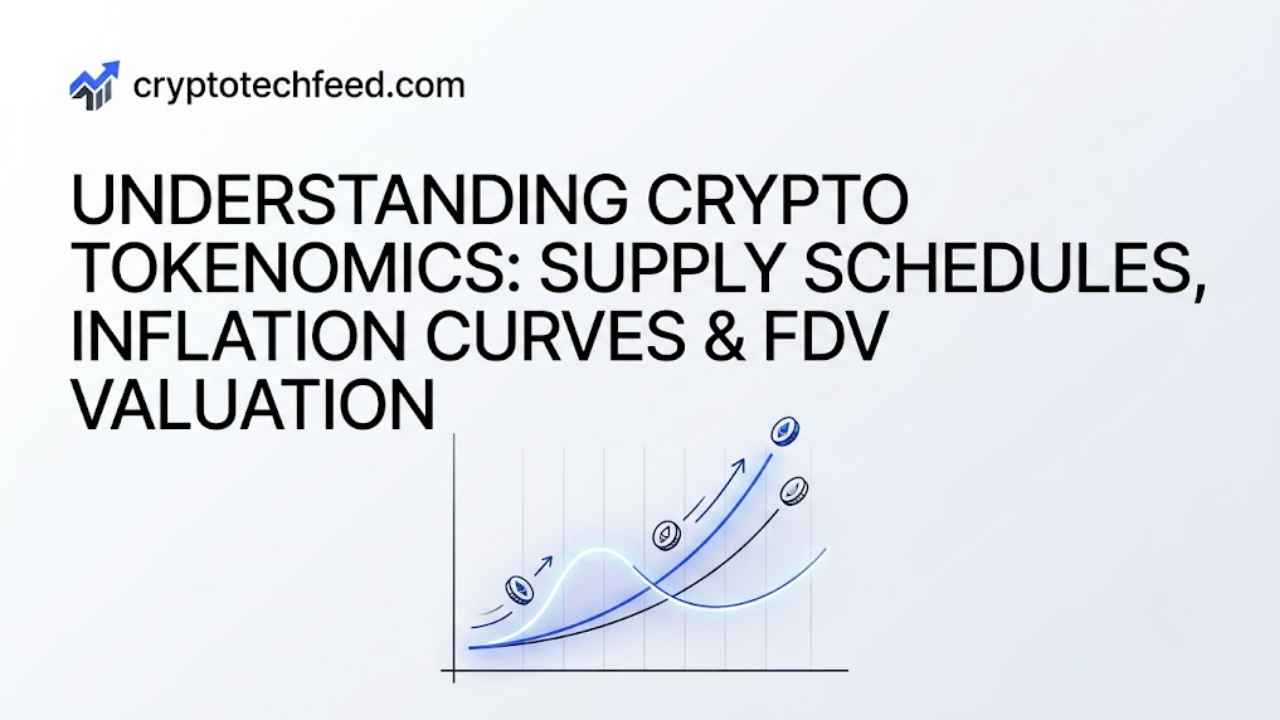
Picture three different curve shapes on the same chart. Bitcoin’s curve looks like a staircase heading downward, a fixed supply cap with issuance cut in half roughly every four years at the halving, trending toward zero new coins by around 2140. Ethereum’s curve is closer to a flat, low hum, issuance that adjusts dynamically based on staking participation and gets partially offset by fee burning, so net inflation can sit near zero or even go slightly negative during high activity periods. Then there’s the third shape, common among newer Layer 1s and DeFi tokens, a steep curve that starts high to bootstrap early liquidity and rewards, and is supposed to taper down over several years, though plenty of projects quietly extend or restart emissions when treasuries run low.
None of these curves are inherently good or bad. What matters is whether real demand, actual usage, fees, staking lockups, is growing fast enough to absorb whatever the curve is printing. A high inflation rate feeding genuine demand can be perfectly healthy. The same inflation rate feeding a token nobody is actively using is just dilution wearing a nicer name.
Fully Diluted Valuation vs Market Cap: The Metric That Actually Matters
This is the comparison that trips up more buyers than anything else in tokenomics, so it’s worth sitting with directly.
Market cap is current price multiplied by circulating supply, tokens actually out and tradeable right now. Fully diluted valuation is current price multiplied by total supply, including every token still locked, vested, or not yet minted. The FDV number answers a blunt question: what would this project be worth if every token that will ever exist were unlocked and trading today at the current price.
The ratio between the two tells you almost everything. A token trading close to 1x, meaning market cap and FDV sit near each other, has most of its supply already circulating and comparatively little dilution ahead. Push that ratio to 3x or higher and you’re looking at a project where the majority of supply is still locked away, waiting to hit the market. Industry data through 2026 has consistently shown that tokens launching with an FDV to market cap ratio above 5x see average drawdowns of 50 to 80 percent within twelve months of their major unlock events. That’s not a rare outlier pattern, it’s close to the default outcome for the low float, high FDV structure.
Binance Research has estimated roughly 155 billion dollars worth of tokens are scheduled to unlock between 2024 and 2030 across the industry. That’s supply that has to find buyers eventually, project by project, unlock by unlock. Checking the FDV to market cap ratio before buying isn’t optional homework anymore, it’s the single fastest gut check for how much future selling pressure you’re quietly signing up for.
Reading the Full Picture Together
None of these pieces work in isolation. A low FDV to market cap ratio doesn’t save you from a brutal emissions curve. A clean emissions curve doesn’t help if 60 percent of supply unlocks in one cliff event next quarter. The way to actually evaluate a token is to stack all three images from earlier, the distribution pie chart, the vesting timeline, and the emissions curve, on top of each other and ask one question of the combined picture: over the next twelve months, is new supply going to outrun demand, or is demand growing fast enough to absorb it.
Tokenomics Quick Reference
| Metric | What it measures | Red flag to watch |
|---|---|---|
| Token distribution | Who holds what share of total supply | Team and VC wedges exceeding 40 to 50 percent combined |
| Vesting cliff | Delay before locked tokens can be sold | Large single tranche unlocking into thin trading volume |
| Token inflation rate | Pace of new token issuance | Inflation rate consistently outpacing usage or fee growth |
| Emissions curve | Shape of issuance over time | Emissions extended or restarted after the original schedule |
| FDV to market cap | Circulating value vs full future value | Ratio above 5x with most supply still locked |
FAQ
What is crypto tokenomics in simple terms? It’s the design of a token’s supply and distribution, covering how many tokens exist, who holds them, when locked tokens unlock, and how quickly new tokens enter circulation.
What is a token vesting cliff? It’s a fixed waiting period after a token launches during which none of a specific allocation, usually team or investor tokens, can be sold, followed by a gradual or lump sum unlock once the cliff ends.
Why does fully diluted valuation vs market cap matter so much? Market cap only reflects tokens currently trading. FDV reflects the project’s value if every token that will ever exist were circulating today, which exposes how much future dilution is still ahead.
What’s considered a healthy FDV to market cap ratio? Generally 1x to 1.5x is considered low risk, 1.5x to 3x moderate, and anything above 5x has historically correlated with steep drawdowns once major unlocks arrive.
Does a high token inflation rate always hurt price? Not automatically. High inflation feeding strong, growing real demand can be sustainable. The same inflation rate against flat or shrinking demand almost always shows up as price decline.