
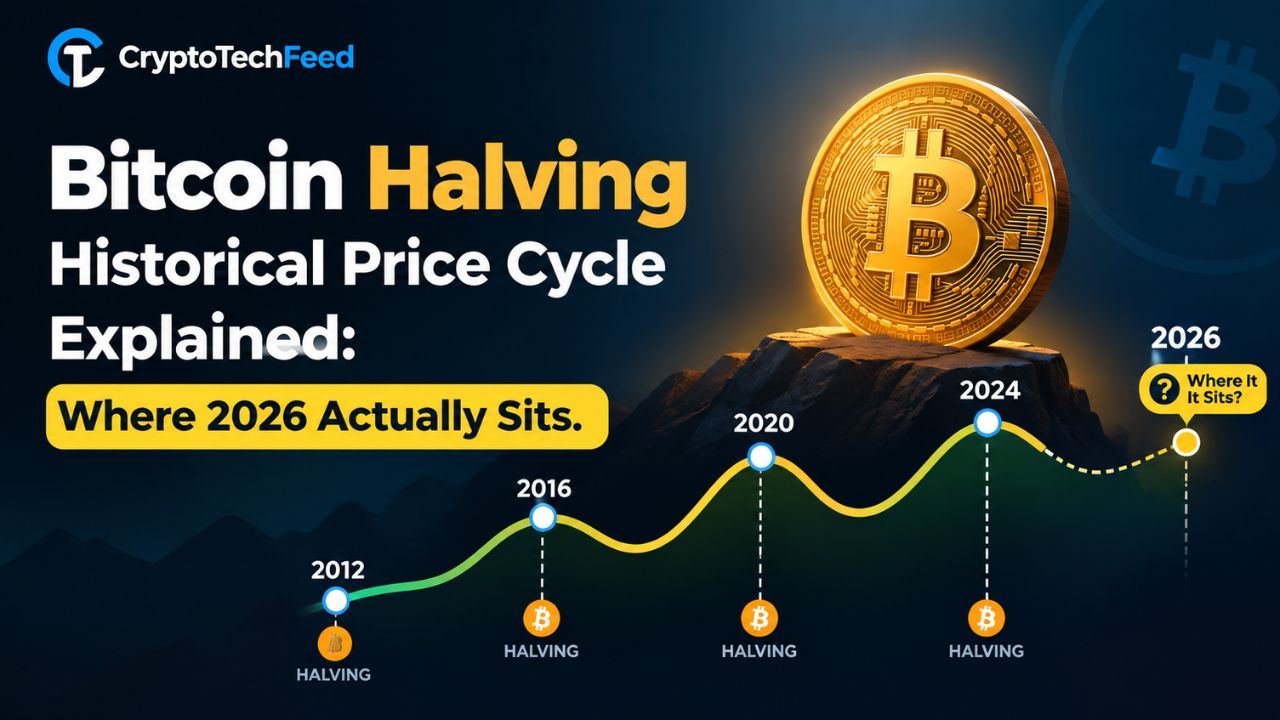
Let’s start with the awkward part.
If you came here looking for the 2026 Bitcoin halving, I’ve got news that’s either a relief or a gut punch depending on what you were hoping for. There is no halving in 2026. The last one happened on April 20, 2024, at block 840,000, when the mining reward dropped from 6.25 BTC to 3.125 BTC. The next one is roughly eighteen months out, somewhere around April 2028.
So why does “bitcoin halving 2026” get searched so much? Because 2026 is the year the cycle turns ugly. And when things get ugly, people go looking for the mechanism that’s supposed to explain it.
That’s what this piece is about. Not a countdown clock. The actual bitcoin halving historical price cycle, what it’s done four times over, why it worked, and the genuinely uncomfortable question of whether it still does.
What a halving actually does (the 90-second version)
Bitcoin’s code releases new coins to miners as a reward for adding blocks. Every 210,000 blocks, call it four years, that reward gets cut in half. Automatically. No vote, no committee, no press conference.
Here’s the thing people miss: the halving doesn’t create demand. It only throttles new supply.
- 2009–2012: 50 BTC per block
- 2012–2016: 25 BTC
- 2016–2020: 12.5 BTC
- 2020–2024: 6.25 BTC
- 2024–2028: 3.125 BTC
At the current rate, roughly 450 new BTC hit the world each day. Before April 2024 it was 900. Before 2020, 1,800.
Think of it like a tap that gets tightened by half every four years, feeding into a bathtub. If the drain stays the same and the tap keeps tightening, the water level should rise. That’s the whole theory. Elegant, mechanical, and, as we’ll see, increasingly not the main thing moving the water.
The historical price cycle, halving by halving
This is where the four-year religion came from. And honestly? Looking at the numbers, you can see why people believed.
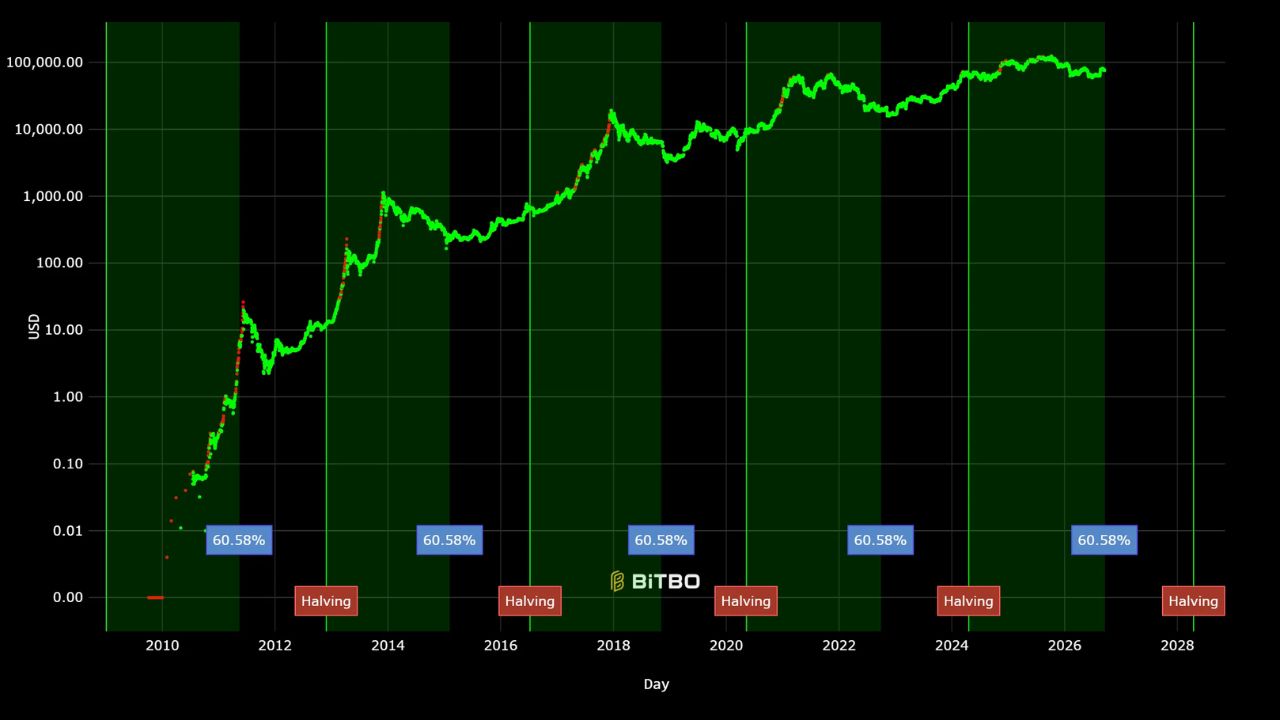
Halving #1 — November 28, 2012. Bitcoin traded around $12 on the day. By late 2013 it had cleared $1,000. Nobody was priced in, nobody was hedged, and barely anyone outside a forum understood what had just happened.
Halving #2 — July 9, 2016. BTC sat near $650. The immediate aftermath was boring — price actually chopped sideways for months. Then December 2017 arrived and Bitcoin touched roughly $19,800. Seventeen months from halving to peak.
Halving #3 — May 11, 2020. Around $8,600 on the day. Eighteen months later, November 2021, a peak near $69,000.
Halving #4 — April 20, 2024. BTC was already near $64,000. And this is the one that broke the pattern, the all-time high near $126,000 came in October 2025, roughly eighteen months out, which sounds on-schedule until you remember Bitcoin had already made new highs in March 2024, a full month before the halving.
That had never happened before. Not once. The spot ETF approvals in January 2024 pulled a year of demand forward, and the halving arrived at a market that had already had its party.
The four phases (and why traders swear by them)
Strip away the specifics and every cycle has looked structurally similar:
- Accumulation — the twelve or so months after the halving. Price grinds. Retail is bored or gone. Supply tightens quietly.
- Expansion — demand catches up to the constrained supply. Price starts moving in a way that gets noticed.
- Distribution — the top. Euphoria, leverage, your cousin asking about altcoins at a wedding.
- Correction — the bear market. Historically brutal: drawdowns in the 76–85% range, lasting twelve to eighteen months.
If you map 2026 onto that, we’re squarely in phase four. Which is exactly why you searched for a halving that isn’t happening.
The part nobody puts in the thumbnail: diminishing returns
Here’s what the maximalist threads skip over.
Each cycle has delivered dramatically less than the last:
- 2013 cycle: roughly 50x from the halving
- 2017 cycle: roughly 20x
- 2021 cycle: roughly 7x
- 2024–25 cycle: roughly 2x from the halving-day price
See the curve? It’s not a straight line down, but the direction is unmistakable. And it makes complete sense once you think about market size. Moving a $200 million asset 50x takes a few thousand enthusiastic buyers. Moving a $1.5 trillion asset 50x would require more capital than exists in most sovereign wealth funds combined.
I keep seeing people project the 2013 multiple onto today’s market cap and arrive at numbers that would make Bitcoin worth more than the global bond market. That’s not analysis. That’s arithmetic with the reality check removed.
The halving’s relative impact shrinks too. When issuance drops from 900 to 450 BTC a day, you’re removing about $35 million of daily sell pressure at current prices. Meanwhile, spot ETFs routinely move multiples of that in a single session. The supply cut is real. It’s just no longer the biggest number in the room.
What actually broke the cycle: institutions
This is the genuine analytical shift of the last two years, and I think it matters more than any halving date.
Before 2024, the marginal seller in Bitcoin was a miner. Miners had electricity bills denominated in dollars and Bitcoin denominated in hope, so they sold steadily, and cutting their income in half meaningfully changed the market’s supply-demand balance.
Now? ETFs and corporate treasuries move more Bitcoin in a day than miners produce in over a week. When those flows are positive, price rises regardless of what issuance is doing. When redemptions hit, price falls regardless of how tight the block reward is.
The halving still enforces scarcity, that’s the mechanical backbone of the whole system and it isn’t going anywhere. But scarcity is now the background condition, not the trigger. The trigger is flows. And flows respond to interest rates, risk appetite, regulatory headlines, and quarterly allocation decisions made by people who have never read the whitepaper.
Some analysts have declared the four-year cycle dead outright. I’d put it differently: the cycle didn’t die, it got outvoted. The halving is still in the room. It just doesn’t have the loudest voice anymore.
Where Bitcoin stands in September 2026
Let’s be concrete, because vague market commentary helps nobody.
As of early-to-mid September 2026, BTC has been trading in the upper-$70,000s, around $78,000–$79,000, having recently lost the $80,000 level. That’s roughly 40% below the October 2025 peak near $126,000.
A few things worth noting about that number:
- It’s a shallower drawdown than any previous bear market at the equivalent point. The 2018 and 2022 bottoms both took Bitcoin down 76%+ from the top. A 40% correction, in historical terms, is almost polite.
- Price is still holding above its 200-day EMA (around $72,800), which historically separates a correction from a full structural breakdown.
- Bitcoin already tested the $60,000 zone earlier in the cycle and recovered from it, which some read as underlying bid strength.
Where does the pattern put the bottom? Most cycle-based models cluster the window somewhere between October 2026 and January 2027, twelve to eighteen months past the October 2025 top.
I’d hold that loosely. A pattern with four data points, one of which already broke the script, is a hypothesis and not a forecast. Anyone giving you a date with confidence is selling something.
So what do you actually do with this?
Not financial advice, obviously. But here’s how I’d think about the bitcoin halving historical price cycle going into 2027 and the 2028 halving:
Stop using the halving as a timing tool. Its predictive power was always partly coincidence, the 2012, 2016 and 2020 halvings each landed near favourable liquidity conditions. Separating the supply cut from the macro backdrop was never as clean as the charts made it look.
Watch ETF flows instead of block rewards. Net creations and redemptions are published, they’re timely, and they’re currently the closest thing to a real-time demand gauge. If you only track one number, track that one.
Respect the diminishing-returns curve. Build your expectations off 2x–3x moves, not 20x moves. If the upside surprises you, wonderful. Planning around it is how people end up over-leveraged at a top.
Understand that “the cycle is dead” is also a claim. It’s been said before every cycle, and the four-year rhythm keeps showing up anyway. The honest position sits in the middle: the halving matters less than it did, and more than the sceptics say.
Know the actual dates. No halving in 2026. Next one around April 2028, when the reward drops from 3.125 to 1.5625 BTC. If history rhymes even faintly, the interesting price action begins before the event, not after it.
Three halving myths that refuse to die
“The halving causes the bull run.” It correlates with bull runs. That’s a different sentence. Four data points spread across fifteen years, every one of them landing in a different macro environment, is not enough to establish causation, and the 2024 cycle, where the high came partly before the event, is the clearest counterexample we’ve got.
“Miners capitulate after every halving, so price dumps.” Hash rate does dip in the weeks after a halving as the least efficient rigs switch off. Then difficulty adjusts, the survivors get more profitable, and hash rate makes new highs. After the 2020 halving it took about seven weeks. This has happened four times now and it has never once produced the death spiral people warn about.
“The supply shock is instant.” It isn’t. The reduction in daily issuance is a slow drip that takes months to register in exchange balances. The market usually front-runs it, then forgets about it, then rediscovers it eighteen months later and calls it a supply shock.
Bitcoin halving FAQ
Is there a Bitcoin halving in 2026? No. The fourth halving occurred on April 20, 2024. The fifth is projected for around April 2028 at block 1,050,000.
What will the block reward be after the 2028 halving? It drops from 3.125 BTC to 1.5625 BTC per block, taking daily issuance from roughly 450 BTC to about 225 BTC.
How long after a halving does Bitcoin usually peak? Historically twelve to eighteen months. The 2024 cycle stretched to roughly eighteen months, with the high near $126,000 in October 2025, though new highs had already been set before the halving itself.
How big have past bear markets been? Drawdowns of 76–85% from the peak, typically lasting twelve to eighteen months. The current correction, at roughly 40% off the high, is notably shallower than any prior cycle at this stage.
When does the last Bitcoin get mined? Around the year 2140, when the block reward rounds down to zero. After that, miners are compensated purely through transaction fees — which is a genuinely open question about Bitcoin’s long-term security budget, and a topic for another article.
The four-year cycle gave a generation of Bitcoin holders a story to hang their conviction on, and there was real value in that. Programmed scarcity, verifiable on-chain, immune to anyone’s opinion.
But the market that story was written for doesn’t exist anymore. Somewhere between the ETF approvals and the pension fund allocations, Bitcoin stopped being the asset that miners priced and became the asset that institutions price. The halving didn’t stop working, it just stopped being the loudest thing happening.
Eighteen months to the next one. The tap tightens again either way.