

Bitcoin gained about 44% in three months. Zcash gained 295%. Uniswap gained 248%. Put those three numbers side by side and you see the real problem with watching crypto prices. The biggest coin is not always the fastest coin. Sometimes it is not even the wisest one to hold. On September 30, 2026, Bitcoin trades near $83,300 and the whole market sits close to $2.9 trillion. Under those tidy headline numbers, the picture is messy. A few coins are sprinting. Many are bleeding. Most are stuck in the middle, waiting for a reason to move. This guide sorts through all of it.
Here is what you get. First, a clean price update for the top coins. Then the forces pushing them around, from Federal Reserve rate hikes to ETF flows. After that comes a coin by coin analysis of Bitcoin, Ethereum, XRP, Solana, BNB, Dogecoin and Cardano. Then the part most articles skip: direct comparisons, so you can weigh risk against reward. Every figure comes from data published between September 28 and 30, 2026. Prices move by the minute, so treat this as a snapshot, not a signal. Nothing here is financial advice. It is analysis, written to help you think clearly.
Crypto Prices Today: Market Snapshot for September 30, 2026
Start with the big picture. The total crypto market cap is around $2.88 trillion to $2.90 trillion, depending on the tracker. Bitcoin dominance sits near 58%. That means almost 6 of every 10 dollars in crypto is parked in Bitcoin. The market slipped about 3% on September 28 while trading volume jumped 125%. Analysts read that as forced liquidations, not fresh buying. On September 29, 81 of the top 100 coins closed red. Bitcoin fell about 2.3% over 24 hours, almost matching the drop in an equal weighted index of 100 coins. It was a market wide wobble, not a single coin story.
The table below pulls the main prices together. Numbers are rounded and come from CoinDesk, Coinbase, CoinGecko and CoinMarketCap readings on September 29 and 30. Small gaps between platforms are normal. Each exchange prices coins slightly differently. Market caps are approximate. Use the table as a quick reference, then read the coin by coin sections for the reasoning. Notice how far most coins sit below their record highs. Bitcoin is about 34% below its peak. Solana is about 59% below. Cardano is about 92% below its 2021 high. That gap is the most honest number on this page.
| Coin | Price (USD) | Approx. Market Cap | Distance From Record High |
|---|---|---|---|
| Bitcoin (BTC) | $83,300 | $1.67 trillion | About 34% below $126,210 |
| Ethereum (ETH) | $2,672 | $326 billion | About 46% below roughly $4,950 |
| XRP | $1.50 | $94 billion | About 59% below roughly $3.65 |
| BNB | $757 | About $105 billion (estimate) | About 45% below roughly $1,370 |
| Solana (SOL) | $119 | $70 billion | About 59% below $293.31 |
| Dogecoin (DOGE) | $0.095 | $14.9 billion | About 87% below $0.7376 |
| Cardano (ADA) | $0.252 | $9.3 billion | About 92% below roughly $3.09 |
What Is Moving Crypto Prices Right Now
The Federal Reserve is the loudest voice in the room. On September 16, it raised rates by 25 basis points to a range of 3.75% to 4%. It was the first hike since 2023, and the vote was unanimous at 12 to 0. Crypto did not panic. Bitcoin dipped toward $75,000, then climbed back above $76,000. The reason was the dot plot. It pointed to a median rate of 4.1% at the end of both 2026 and 2027, which implies only one more hike. Traders read that as a limited squeeze, not a long tightening cycle. It was relief, not celebration.
That relief is fading a little. Markets now price a 65% chance of another hike in October, according to Nischal Shetty, founder of WazirX. Treasury yields sit near their highest levels since 2007, says a Delta Exchange analyst. Brent oil has climbed for two straight days, and global stocks touched a one week low. All of that is bad weather for risk assets. The August PCE inflation print, the Fed’s preferred gauge, lands on September 30. Friday’s payrolls report follows. A hot number could lift hike odds and drag Bitcoin toward support. A soft one could send it back to $85,000.
Beyond the Fed, four other currents shape the daily moves:
- ETF flows: US spot Bitcoin ETFs saw roughly $296 million in net outflows on September 16. Steady inflows since then have cushioned each dip.
- Solana ETF demand: CoinGecko notes that Solana ETF inflows have surged and outpaced XRP, which is pulling institutional attention.
- Privacy coin frenzy: Zcash hit a record after Paradigm disclosed a stake, then fell 12% on September 29. Hot coins swing both ways.
- Altcoin volume: A report citing Glassnode says altcoin spot volume has risen to nearly four times Bitcoin’s volume, the highest since September 2025.
Bitcoin Price Analysis: The Anchor Holds, But the Ceiling Is Real
Bitcoin trades near $83,300 to $84,000. That is roughly a 9% climb from the $76,621 level it printed right after the Fed decision. August was strong too. Bitcoin rose about 24%, its best month of 2026, and CoinDCX noted a golden cross in September, the first in about 280 days. Those are real positives. But the record high of $126,210 from October 2025 still looms. Bitcoin sits about 34% below it. Any recovery story has to be told against that number. Bulls call this a healthy rebuild. Bears call it a long bounce inside a bigger downtrend. Both camps have data.
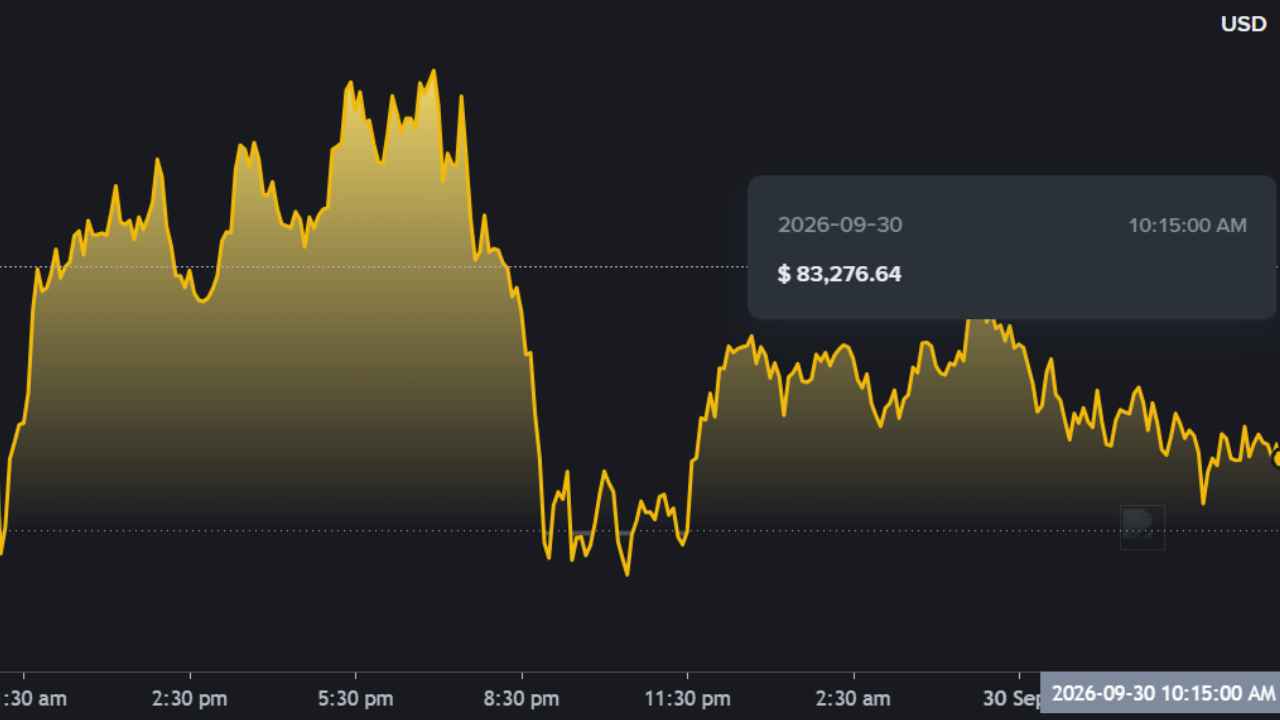
The chart tells a simple tale. Resistance sits near $85,000. Bitcoin was rejected there this week, according to Delta Exchange’s research analyst. The nearest support is the $83,000 area, then the $76,000 zone where buyers stepped in after the Fed hike. Funding rates on derivatives turned positive and rose after the hike, a sign that leverage was building. That matters. Leverage makes moves violent in both directions, as the September 28 liquidation wave showed. When price sits between a ceiling and a floor this close together, patience beats prediction. Wait for a daily close outside the range before you trust a breakout.
Institutions are the quiet driver. Spot ETF flows have been uneven, but the steady inflows have softened each dip. Corporate treasuries keep adding too. Hyperscale Data, listed on NYSE American, disclosed $56 million in Bitcoin and cash, worth about 153% of its own stock market value. That is a small company making a big bet. Bitcoin’s dominance near 58% to 59% shows the same story from another angle. New money still enters through Bitcoin first. Everything else waits its turn, or never gets one. That is the uncomfortable truth behind the headline rally. Watch for more such filings as quarter end approaches.
So what is the honest read? Bitcoin looks like the stable core of the market, not an explosive trade. Its 44% three month gain is impressive for a $1.6 trillion asset. But it also depends on macro calm. If the PCE print surprises higher and October hike odds climb, Bitcoin could revisit the mid $70,000s. If inflation cools, a push through $85,000 opens the road toward $90,000. Neither outcome is certain. What is certain is that Bitcoin will keep setting the mood for every other coin on this list. Watch it first, then decide about the rest.
Ethereum Price Analysis: Solid Network, Stubborn Chart
Ethereum trades near $2,672 with a market cap of about $326 billion. It fell roughly 3% over the past week, slightly worse than Bitcoin’s 2.4% drop. The record high near $4,950 came in August 2025, so ETH sits about 46% below its peak. That is a bigger discount than Bitcoin carries. Some traders see value in that gap. Others see a coin that keeps losing the relative race. ETH rarely moves alone. When Bitcoin drops 2%, Ethereum often drops 2.5% or more. On the way up, it needs Bitcoin to lead first before it can catch fire. That dependence is Ethereum’s biggest chart problem.
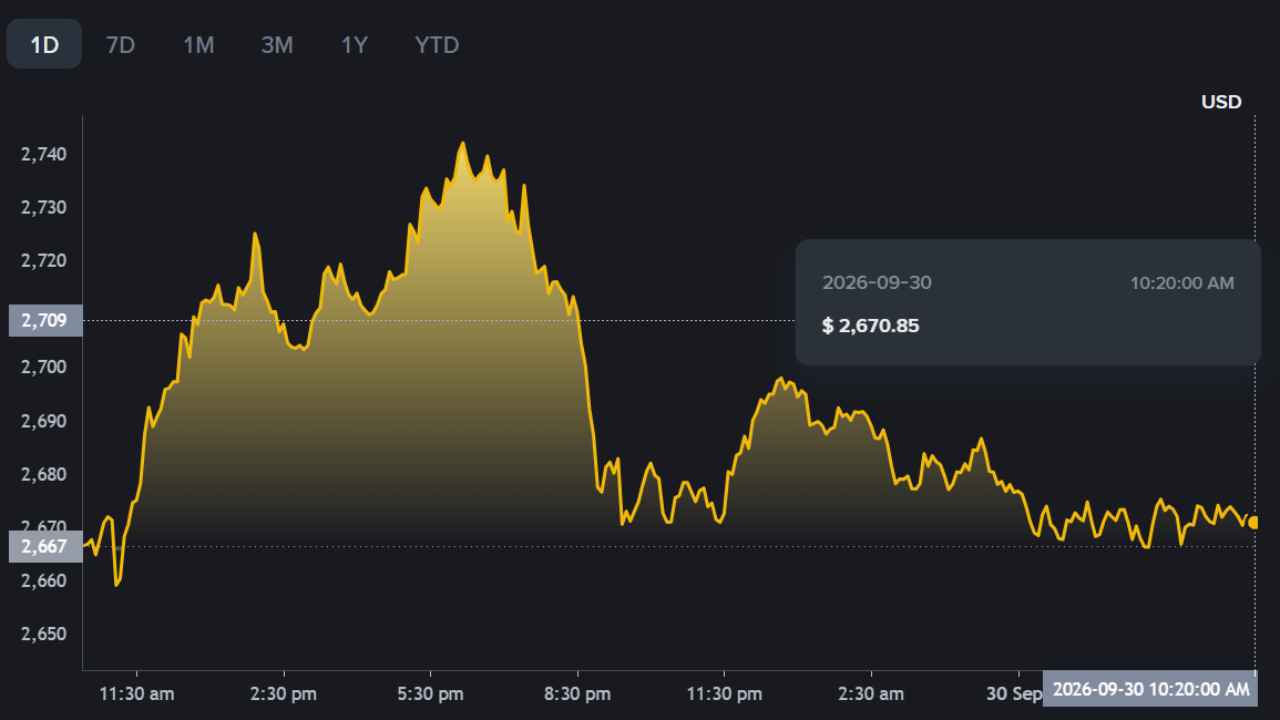
There is one bright spot. One report says the ETH to BTC ratio broke a downtrend that lasted almost five years. If that holds, Ethereum could start outperforming Bitcoin for the first time in a long stretch. I would treat it with care. A single breakout on a ratio chart is a signal, not a guarantee. Ethereum’s real strength sits elsewhere. It still hosts a large share of decentralized finance, stablecoin supply and tokenized assets. Demand for block space and staking yield gives it a fundamental floor that meme coins simply do not have. That floor keeps long term holders calm.
For price levels, think in round numbers. The $2,600 area is the first line of support, and $2,800 is the first hurdle. Round numbers attract orders, so they often act as magnets. A close above $2,800 would suggest buyers are regaining control. A slip under $2,600 would put the lower end of the recent range in play. Ethereum’s next big test is relative, not absolute. Can it hold its gains against Bitcoin when the macro mood turns sour? If yes, the ratio breakout has teeth. If not, it was a false dawn, and ETH stays a follower instead of a leader.
XRP Price Analysis: Big Attention, Modest Price Action
XRP trades around $1.49 to $1.50 with a market cap near $94 billion. That keeps it in the top five by size. The coin sits roughly 59% below its 2025 peak near $3.65. Weekly moves depend on when you look. One snapshot showed XRP down about 5% on the week, while another showed less than 1%. That gap tells you something. XRP has been choppy, not trending. It tends to jump on headlines and fade when the news cools. Traders who chase those headlines often buy near the top of a spike. Patience has paid better than reaction in recent weeks.
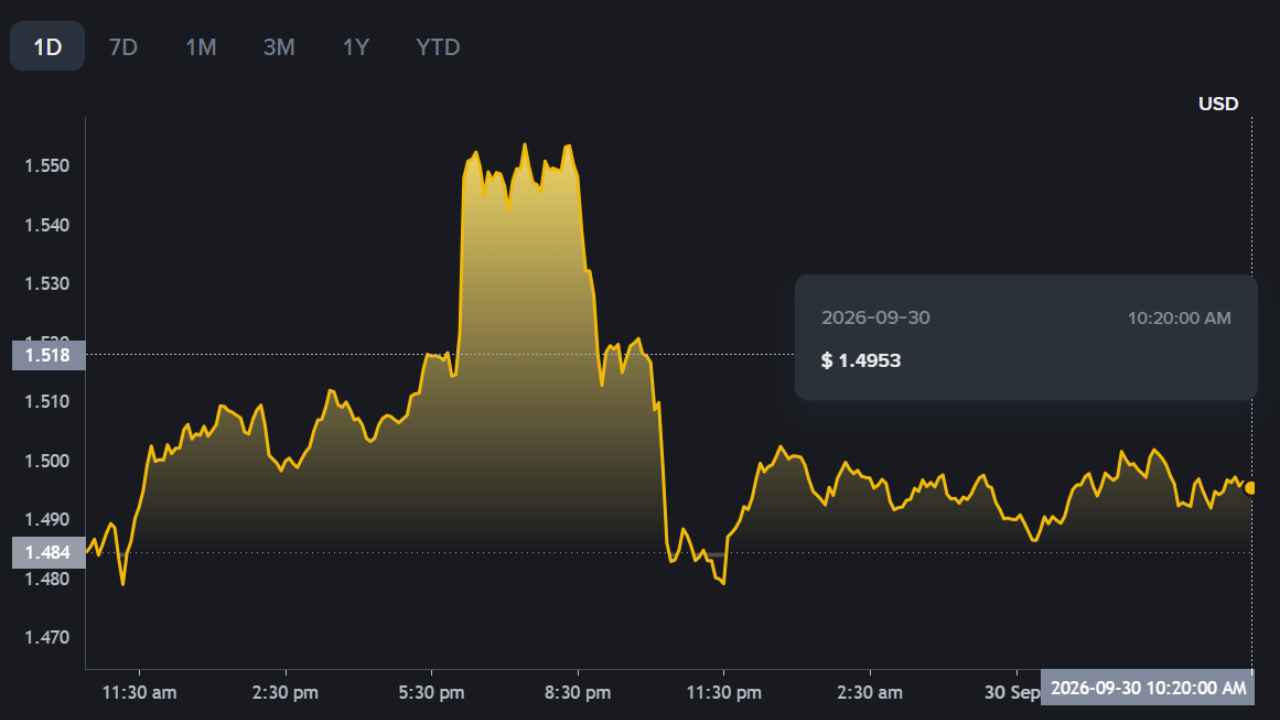
The bull case rests on utility and institutions. XRP is built for fast, low cost cross border payments. ETF products and clearer US rules have widened the pool of buyers. The bear case is just as simple. Solana ETF inflows have reportedly outpaced XRP’s, which suggests fresh institutional money has other favorites right now. If you hold XRP, the question is not whether the technology works. It does. The question is whether demand can grow fast enough to lift a $94 billion coin. That takes real capital, not just noise. Until that capital shows up in volume, expect XRP to stay range bound.
Solana Price Analysis: The Altcoin With Momentum
Solana trades near $119 to $120. CoinGecko shows a 24 hour range of $117.18 to $121.58 and a seven day range of $112.72 to $124.77. That is a tight band. Solana’s market cap is about $70 billion, and it ranks seventh on CoinDesk’s list. It is still about 59% below its record high of $293.31. Yet Solana has been one of the more resilient large coins this month. It gained around 0.5% over the week while Bitcoin and Ethereum slipped. In a red market, flat looks like green. That relative strength is why traders keep putting SOL on their watchlists.
Why is it holding up? ETF demand is a big part of the answer. CoinGecko says Solana ETF inflows have surged and outpaced XRP. Solana is also known for fast blocks and very low fees, which suits payments, trading apps and consumer products. The risk is familiar. Solana is a high beta coin. It usually falls harder than Bitcoin when fear spreads, and it rises faster when hope returns. That makes it a favorite for active traders and a headache for anyone who hates volatility. Size your position for the bad days, not the good ones. A 20% drawdown should not force you to sell.
One more angle deserves attention: the range itself. A coin trading inside a $12 weekly band is coiling. Coiling does not reveal direction. It only tells you a bigger move is coming. Watch $125 on the upside and $112 on the downside. Those are the edges of the seven day range. A break of either level, backed by strong volume, would be the first real clue about where Solana heads into October. Until then, avoid pretending you know. Wait for the market to show its hand, then respond with a plan you wrote down beforehand. Discipline matters more than cleverness here.
BNB Price Analysis: The Quiet Giant
BNB trades around $757 to $759, and it barely moves on a daily basis. Over the past week it slipped about 1% to 4%, depending on the tracker. That steadiness is its selling point. BNB powers the Binance ecosystem, from trading fee discounts to BNB Chain, so demand comes from real use. It sits roughly 45% below its October 2025 peak near $1,370. Compared with Dogecoin or Cardano, that is a mild drawdown. Compared with Bitcoin, it is deeper. For investors who want exposure beyond Bitcoin without wild swings, BNB has become the default middle path. It is not exciting. That may be the whole point.
Dogecoin Price Analysis: Whale Buying Meets a Stubborn Wall
Dogecoin trades near $0.095 with a market cap of about $14.9 billion. It ranks around 11th or 12th. The 24 hour range ran from about $0.0918 to $0.0959. According to CryptoTicker, DOGE is up roughly 13% over 30 days but down about 58% over twelve months. Both facts are true at once. That is why meme coin analysis feels so slippery. A good month can hide a terrible year. The record high is $0.7376, so DOGE sits about 87% below its peak. Anyone buying today is betting on a bounce, not a return to old highs.
Two details stand out. First, reports citing Benzinga say analyst Ali Martinez saw large holders add 1.14 billion DOGE between September 24 and 28. Whale buying like that can signal confidence. Second, he flagged $0.098 as the wall to beat, since about 28 billion DOGE changed hands near that level before. Support sits near $0.079. A clean break above $0.098 could open a run toward $0.20, but that is a distant target. Also note the ETF picture. All US Dogecoin funds together hold about $17 million, roughly one thousandth of the coin’s market cap. That is tiny. Do not overrate the ETF headline.
Cardano Price Analysis: Low Price, Heavy History
Cardano trades near $0.252 with a market cap of about $9.3 billion, ranking around 14th, per CoinMarketCap. It gained roughly 3.5% in 24 hours, a nice bounce on a red day. Circulating supply is 36.77 billion out of a 45 billion maximum. That leaves room for dilution, though far less than many newer tokens face. ADA is about 92% below its 2021 high of roughly $3.09. Beginners often see a 25 cent price and think it is cheap. Price per coin says nothing about value. Market cap does. At $9.3 billion, Cardano is valued far below Solana’s $70 billion. Ask yourself what that gap means for you.
Stablecoins: The Coins That Refuse to Move
Not every coin is a price bet. Tether trades near $1 with a market cap around $184 billion. USDC sits at $1.00 with roughly $74 billion. These stablecoins are the cash of the crypto market. Traders park money there when fear rises, then rotate out when confidence returns. Their sheer size tells you something useful. A huge stablecoin supply means dry powder is waiting on the sidelines. It does not guarantee a rally. It only shows the fuel exists. When you compare coins, remember that stablecoins solve a different problem. They aim for zero price movement, so the risk to check is trust, not volatility.
Crypto Coin Comparison: Head to Head
Bitcoin versus Ethereum is the classic matchup. Bitcoin is a store of value story with a $1.67 trillion market cap and a fixed supply of 21 million coins. Ethereum is a platform story with a $326 billion market cap and constant network activity. Bitcoin is about 34% below its record. Ethereum is about 46% below. Bitcoin moved less this week. Ethereum offers more upside if the ratio trend continues. Choose Bitcoin if you want the simplest, most liquid bet. Choose Ethereum if you believe smart contracts will keep growing. Many holders own both, and that is a fair answer.
XRP versus Solana is a closer fight than the price suggests. XRP has a market cap near $94 billion, and Solana about $70 billion. XRP trades near $1.50, Solana near $119. Do not compare coin prices. Compare market caps. XRP leads on payments and long standing institutional relationships. Solana leads on developer activity, consumer apps and, for now, ETF momentum. Solana held its price this week while XRP wobbled. Both sit roughly 59% below their peaks, so their drawdowns are almost identical. The tie breaker is the growth story you trust: payments adoption or app ecosystem growth.
Now widen the lens. The table below sorts all seven coins by size, drawdown and the kind of volatility they tend to show. Treat the volatility labels as my judgment, not a formal rating. Bitcoin and Ethereum absorb shocks better because more money flows through them every day. BNB, XRP and Solana swing more, each for its own reasons. Dogecoin and Cardano can double or halve without much warning. Position size should shrink as you move down the list. The smaller and more speculative the coin, the smaller the bet should be. Stay humble about the small ones.
| Coin | Size Tier | Distance From Peak | Volatility Character | Best Suited For |
|---|---|---|---|---|
| Bitcoin | Mega | About 34% | Lowest of the group | Core holding |
| Ethereum | Large | About 46% | Moderate | Smart contract exposure |
| BNB | Large | About 45% | Low to moderate | Exchange ecosystem exposure |
| XRP | Large | About 59% | Headline driven | Payments thesis |
| Solana | Large | About 59% | High | Active traders, growth thesis |
| Dogecoin | Mid | About 87% | Very high | Speculation only |
| Cardano | Mid | About 92% | High | Long shot recovery bet |
Bitcoin Dominance and Altcoin Season: Is the Rotation Real?
Bitcoin dominance is Bitcoin’s share of the total crypto market cap. It reads about 58% to 59% today. When it falls while Bitcoin holds steady, money is usually moving into altcoins. Some data hints at that. A report citing Glassnode says altcoin spot trading volume has reached nearly four times Bitcoin’s, the highest since September 2025. It also says 72.5% of tracked altcoins outperformed Bitcoin through September 23, up from 39% during the August rally. Those are strong numbers. If they hold, they point to broader participation than we saw earlier this month. Rotation may be starting.
Now the caution. A 24/7 Wall St analysis points out that the 3% drop on September 28 came with a 125% jump in volume. That pattern looks like forced liquidations, not healthy rotation. A true altcoin season needs fresh money, not leveraged traders getting flushed out. Gains are also narrow. Zcash’s 295% rise still leaves it under 1% of the total market cap, and it fell 12% on September 29. A handful of hot coins does not make a season. My read: rotation has started, but it is selective. Pick winners with care. Avoid buying everything that shines.
How to Compare Any Two Cryptocurrencies
Prices alone mislead. A $0.25 coin is not cheaper than a $119 coin. Use a repeatable checklist instead. Here are the factors worth checking before you form any view:
- Market cap: Price times circulating supply. It shows the true size of a coin.
- Distance from record high: It shows how much damage a coin has absorbed and how much room it may have.
- Trading volume: High volume means you can exit without moving the price.
- Supply schedule: Fixed, capped or inflationary. Cardano has a 45 billion cap. Dogecoin adds about 5 billion new coins a year.
- Fully diluted value: What the market cap becomes once every token exists.
- Real usage: Fees paid, active users and money settled. Narratives fade. Usage stays.
- Access: ETFs and major exchange listings widen the buyer pool.
Run every coin through these seven checks, and write the answers down. Compare two coins side by side, not one coin against your hopes. You will often find that the coin with the exciting story fails on volume or supply. You will also find that the boring coin passes almost every test. That does not make it a buy. It makes it easier to explain. If you cannot explain in two sentences why you own a coin, you probably own it for the wrong reason. Fix that before you add more. Simple checks beat clever theories every single time.
Price Levels and Scenarios to Watch This Week
Scenario thinking beats prediction. Here are three paths for the coming week or two, based on today’s data. None is a forecast. They are frameworks. The biggest swing factor is the PCE inflation print on September 30, followed by Friday’s payrolls. Both feed straight into the October Fed decision. Crypto now trades like a risk asset tied to interest rates, so inflation numbers move it as much as any coin specific news. Keep that in mind before you read a single chart. Then match what you see to one of these paths:
- Bullish path: Soft inflation data, falling hike odds, and a Bitcoin close above $85,000. Ethereum and Solana follow, and altcoin volume stays elevated.
- Sideways path: Mixed data keeps Bitcoin chopping between $80,000 and $85,000. Altcoins drift, and only the hottest names move.
- Bearish path: Hot inflation lifts October hike odds beyond 65%. Yields climb, Bitcoin revisits the $76,000 zone, and altcoins fall harder.
Notice what the bullish and bearish paths share. Bitcoin leads both. Altcoins follow with bigger swings. This is why I check Bitcoin first every morning, even when I am researching another coin. It also explains the risk in concentrated altcoin bets. A coin with great fundamentals can still fall 15% on a day when Bitcoin drops 3%. Fundamentals matter over months. Macro rules the days. Plan your entries in stages, not in one lump, so a single bad print cannot ruin the whole trade. Staged buying is dull, but it works. Read the data, then read your own risk limits.
Common Mistakes When Reading Crypto Price Updates
Even experienced traders slip on these:
- Chasing green candles: Buying after a 20% pump usually means buying someone else’s exit.
- Comparing coin prices: Always compare market caps and supply instead.
- Ignoring leverage: Liquidation waves like September 28 hurt leveraged traders most.
- Trusting one source: Prices differed by a few hundred dollars across trackers this week, depending on timing.
- Reading ads as analysis: Several price prediction posts this week were press releases promoting presale tokens.
That last mistake deserves a closer look. Paid promotions often wear the costume of analysis. They quote real analysts, cite real numbers, and then pivot to a token nobody has heard of. The pivot is the giveaway. Real analysis discusses risk and shows both sides. Promotion shows only upside and a countdown timer. If an article names a presale coin with a promised return of 100x, close the tab. Nobody can promise that. Cross check any claim against two neutral sources, such as CoinDesk and CoinGecko, before you act. Trust is earned by transparency, not by loud promises.
Buying Crypto in India: Tax Points to Know
Many readers searching for crypto prices today are in India. Prices in rupees move with both the dollar price and the exchange rate, so always check the local exchange quote. Tax matters as much as price. India taxes profits from virtual digital assets at a flat 30%, and losses cannot be set off against other income. On top of that, a 1% TDS applies to transfers above the threshold. These rules can turn a small gain into a small loss after tax. Do the math before you sell, not after. Rules change, so confirm current details with a chartered accountant before filing.
Final Verdict: Which Crypto Looks Best Right Now?
Here is my ranking by risk adjusted attractiveness today, not by hype. Bitcoin ranks first for stability and institutional support. Solana ranks second for momentum and ETF demand. Ethereum ranks third for its fundamental base and improving ratio chart. BNB ranks fourth as a steady, low drama holding. XRP ranks fifth because attention exceeds price action. Cardano ranks sixth as a possible value trap that could still surprise. Dogecoin ranks seventh because whale buying is interesting but the chart remains weak. Reasonable people will disagree with this order. That is fine. Build your own list using the checklist above.
Today’s checkpoint is simple. Bitcoin at $83,300. Resistance at $85,000. Support near $76,000. The PCE print lands today. Everything else on this page depends on how those numbers settle. Check prices on two or more platforms before you trade. Keep leverage low. Write down why you bought each coin. Then let the market prove you right or wrong.
Frequently Asked Questions
What is the Bitcoin price today? Bitcoin trades near $83,300 to $84,000 on September 30, 2026, after a dip of about 2% on September 29. It sits about 34% below its record high of $126,210, set in October 2025. Prices vary slightly by platform, so check two sources.
Which crypto is best to buy now? No coin is best for everyone. Bitcoin offers the most stability. Solana shows the strongest momentum among large coins. Ethereum offers upside if its ratio breakout holds. Your choice depends on your risk tolerance, time frame and budget. This is analysis, not financial advice.
Why is crypto down today? Rate hike fears are the main cause. Markets price a 65% chance of another Fed hike in October, Treasury yields sit near multi year highs, and oil has climbed. On September 29, 81 of the top 100 coins fell. Today’s PCE inflation data could move prices again.
Is altcoin season here? Not fully. Bitcoin dominance is still near 58% to 59%, but altcoin volume has surged and most tracked altcoins have beaten Bitcoin recently. The September 28 volume spike looked like liquidations, though. Rotation looks selective, not broad.
Will Ethereum outperform Bitcoin? It might, but nobody knows. The ETH to BTC ratio broke a nearly five year downtrend, which is encouraging. Ethereum still falls harder than Bitcoin in sell offs. Watch whether the ratio holds during the next market dip.
How do I compare two cryptocurrencies? Compare market cap, not price. Then check distance from record high, trading volume, supply schedule, real usage and access through ETFs or major exchanges. Write down the results side by side. The coin with a clear, simple explanation usually wins.
Sources
- CoinDesk: live price data and Crypto Markets Today, September 17 and September 29, 2026
- Coinbase: Bitcoin and Dogecoin price pages, September 29, 2026
- CoinGecko: Solana price page and Dogecoin data via CryptoTicker, September 29, 2026
- CoinMarketCap: Cardano price page, September 30, 2026
- Blockchain Reporter: Bitcoin price and market breadth report, September 29, 2026
- 24/7 Wall St via Yahoo Finance: altcoin season and Bitcoin dominance analysis, September 28 to 29, 2026
- Analytics Insight: Crypto Prices Today report with WazirX and Delta Exchange commentary, September 29, 2026
- Blockonomi: coverage of the Fed rate hike and ETF flows, September 17, 2026
- CoinDCX: crypto bull run 2026 analysis, September 2026
- Glassnode data as reported by Edaface News: altcoin volume and outperformance, September 29, 2026
Record high figures for Ethereum, XRP, BNB and Cardano are approximate and based on widely reported peaks. BNB market cap is an estimate. Verify all figures before publishing.